My first experience with JavaFx Charts
In one of my previous projects I was involved in developing a 2D line chart which shows the center of gravity of large cargo aircrafts like Airbus A380 and Boeing 747 etc .We used Java2D with more than a thousand lines of code and Richfaces paint2D to draw it as an image on a JSF web page .Being a newbie to the language, I was just wondering how much effort can it take to develop such a chart in JavaFx . I finally managed some time to try it out. So this chart is a Weight vs. Index chart where weight of the aircraft is on the y-axis and change in center of gravity index is on the x-axis. The polygons drawn inside the chart reflect the structural limits of an aircraft. If your current (index,weight) point falls outside these polygons in a certain condition, than the aircraft cannot fly because it is either nose-heavy or tail-heavy so it will crash.
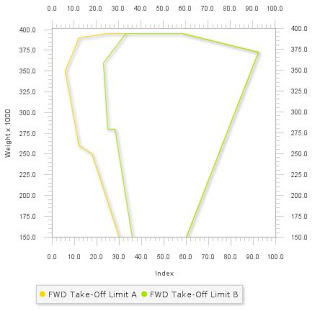
I was able to create the chart shown in the image above with almost 105 lines of code excluding the data inputs,in almost 3 hours. JavaFX charting takes care of drawing axis and tickmarks, tickmark gaps, axis and axis-label gaps, scaling factors, title, legend attributes and many more things like anti-aliasing and drop shadows. You just need to bother about configuring it and providing the chart data.
Launch it here.
Download source code


Comments
Post a Comment